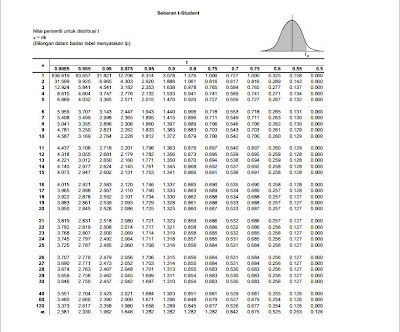
In hypothesis testing, we often need t and F values from tables that are usually available in books or econometric statistics.
But when the sample is large (so that the degree of free too big), usually the figures were not available.
Actually in Microsoft Excel available facilities for calculating t and F of this, regardless of the size of the independent degrees.
How to?
For t table.
1. Place the cursor (pointer) on the cells that you will release the results of t table.
2. Type this formula = TINV (0.05,20). And then press ENTER,
it will exit the t-value table. This is when the error rate of 5% (CI 95%) and the degree of free (df) 20. Of course, you can change these numbers as needed.
For F table.
1. Place the cursor (pointer) on the cells that you will release the results of F table.
2. Type this formula = FINV (0.05,3,20). And then press ENTER, it will exit the value of F table. This is when the error rate of 5% (CI 95%) and degrees of freedom 1 (DF1) = 3 and degrees of freedom 2 (DF2) = 20. Of course, you can change these numbers as needed.
Ok, good luck. Of course you can also download new table t and F table on the left of this blog.
Thank you, Hopefully useful!
Tidak ada komentar:
Posting Komentar